Introduction
Revenue is one of the easiest numbers for a 3PL to understand.
A customer generates ₹10 million in annual revenue. Another generates ₹5 million. A third customer has doubled its shipment volume in two years.
On the surface, these numbers suggest growth.
But revenue does not answer a more important question:
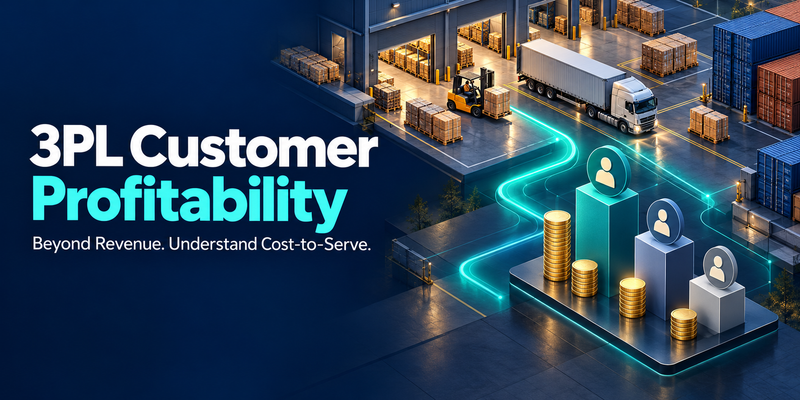
How much profit does each customer actually contribute after the operational cost of serving them?
That question is becoming increasingly important as 3PLs manage more complex customer contracts, multi-site warehouses, transport networks, freight activities, and service requirements.
A customer can generate substantial revenue while consuming disproportionate warehouse space, handling time, transport capacity, labor, and exception-management resources.
Another customer may generate less revenue but deliver a healthier contribution margin with predictable operations and fewer exceptions.
For logistics executives, the next step in analytics is therefore not simply better revenue reporting.
It is customer-level profitability analysis.
Revenue Is Not the Same as Profitability
A 3PL can measure revenue by customer relatively easily.
The difficult part is connecting that revenue to the operational resources consumed to generate it.
Consider two customers.
Customer A
- High shipment volume
- High warehouse activity
- Frequent special handling
- Additional transport requirements
- Frequent exceptions
- High customer-service involvement
Customer B
- Lower shipment volume
- Predictable storage requirements
- Standard handling
- Stable transport requirements
- Few exceptions
- Lower administrative effort
Customer A may generate significantly more revenue.
But Customer B may generate more contribution after the cost of serving each account is considered.
This is why a 3PL should move beyond:
Revenue per customer
toward:
Revenue − Cost to Serve = Customer Contribution
The calculation does not need to be unnecessarily complicated.
The important step is connecting commercial data with operational data.
What Customer Profitability Means in a 3PL
Customer profitability analysis measures the economic contribution of an account after considering the costs associated with delivering its services.
Depending on the operating model, the analysis can include:
- Storage
- Handling
- Picking
- Packing
- Loading and unloading
- Transport
- Freight
- Labor
- Space utilization
- Special services
- Documentation
- Exception handling
- Technology or administrative effort
- Vendor and carrier costs
The exact cost model will vary by organization.
The principle is consistent:
Measure the economics of serving the customer, not just the revenue generated by the customer.
This becomes particularly important when one customer uses multiple services.
A 3PL may provide warehousing, transportation, freight forwarding, and additional value-added services to the same account.
Looking at each service independently can hide the overall customer economics.
The Real Unit of Analysis Is Often the Job
Customer-level profitability is useful, but it may still be too broad.
A large customer can have profitable and unprofitable jobs at the same time.
For example:
- One transport lane may be profitable.
- Another may lose money because of empty returns.
- One warehouse activity may generate healthy margin.
- Another may consume excessive handling labor.
- One freight route may perform within the agreed commercial terms.
- Another may repeatedly create additional costs.
This is where job costing becomes important.
Instead of asking only:
“Is this customer profitable?”
management can ask:
“Which jobs, services, lanes and activities are creating or destroying margin for this customer?”
That produces a much more useful management view.
Store’n Ship-Fast’s published case-study material provides an example of this type of operational-commercial connection. One logistics implementation included a costing sheet for tracking actual and final bids, automated invoicing based on usage, and dashboards for open, closed, and profit-and-loss jobs.
The broader lesson is important: commercial decisions become more useful when they are connected to the operational activity that created the cost or revenue.
Cost-to-Serve Is the Missing Layer
Many 3PLs understand their pricing.
They may know:
- Contract rate
- Storage rate
- Handling charge
- Transport rate
- Freight charge
- Additional service charge
But knowing the price is not the same as knowing the cost to serve.
Consider a warehouse customer paying a storage fee based on pallet positions.
The contract may look profitable.
But suppose that customer also requires:
- Frequent stock movements
- Repeated picking
- Special handling
- Additional loading and unloading
- Frequent inventory checks
- Manual documentation
- Customer-specific reporting
The actual operational cost may be considerably higher than the original pricing model assumed.
This is why cost-to-serve should sit between operational activity and customer profitability.
A useful model is:
Customer
↓
Services Used
↓
Operational Activities
↓
Resources Consumed
↓
Actual Cost
↓
Revenue
↓
Contribution Margin
That gives executives a much clearer view of the economics of the account.
The Data Already Exists — But It Is Often Separated
The information needed for profitability analysis is rarely stored in one place.
Revenue may sit in finance.
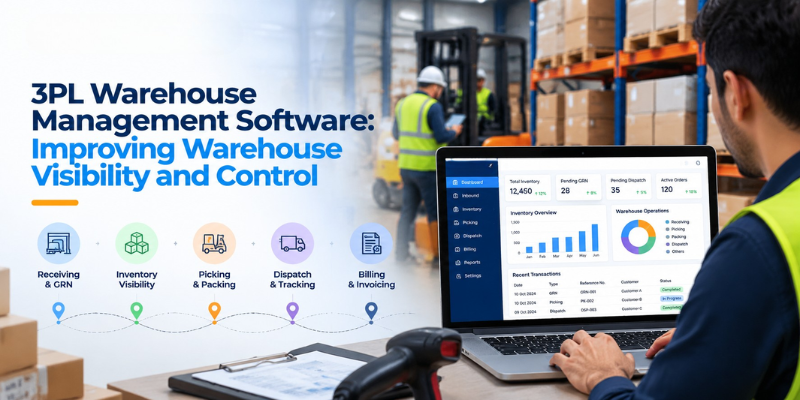
Warehouse activity may sit in WMS.
Transport costs may sit in TMS.
Freight charges may sit in the freight system.
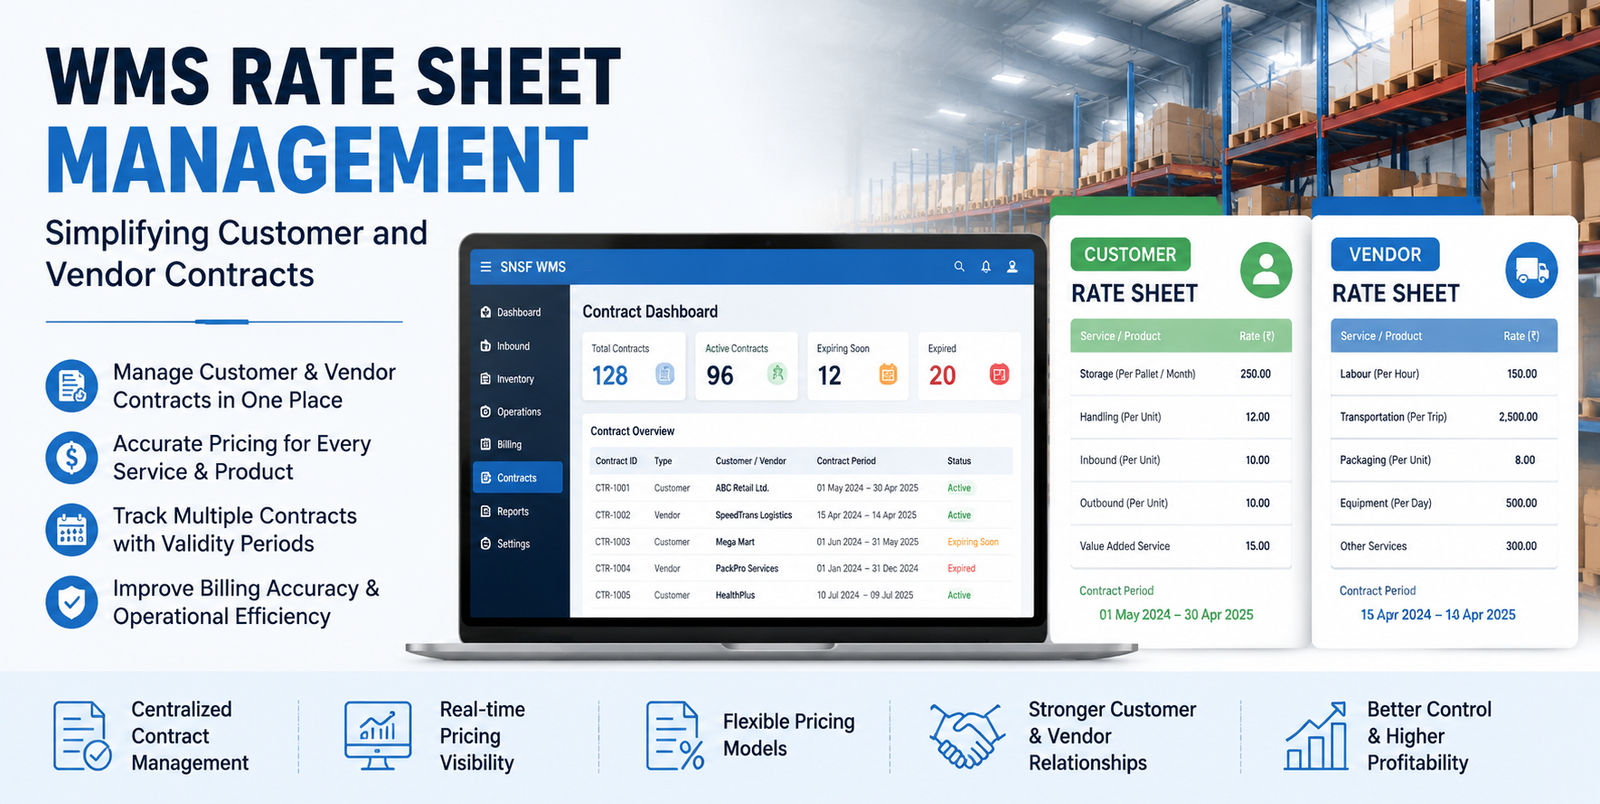
Customer agreements may sit in contracts or spreadsheets.
Vendor costs may be maintained separately.
The challenge is therefore not always a lack of data.
It is the lack of connection between the data.
A 3PL may know how many pallets were stored.
It may know how many orders were picked.
It may know how many kilometres were driven.
It may know what the customer was invoiced.
But unless those records can be connected to the same customer, job, service, or contract, profitability analysis remains incomplete.
This is where an integrated operational data model becomes valuable.
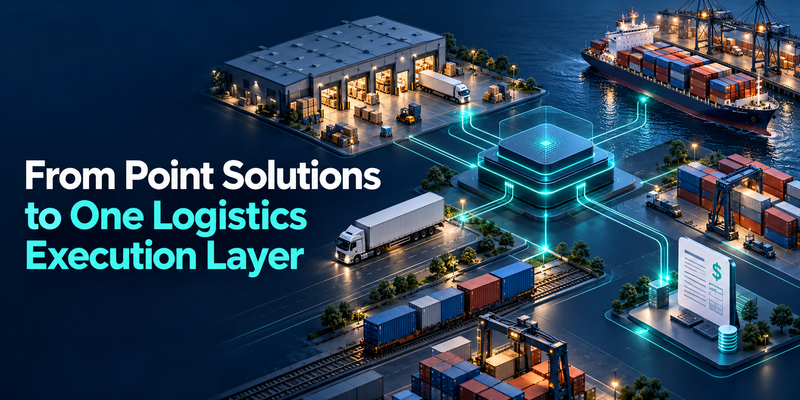
Store’n Ship-Fast’s published platform structure connects customer, quotation, warehouse, transport, freight, depot, document, and billing workflows, while its industry framework identifies customer-wise profitability as a KPI for 3PL operations.
Five Levels of 3PL Profitability Analytics
A useful maturity model can help executives understand where their organization currently stands.
Level 1 — Revenue Reporting
The organization knows how much each customer is billed.
Question answered:
How much revenue did we generate?
Level 2 — Gross Margin
Revenue is compared with major direct costs.
Question answered:
What did the customer contribute after direct costs?
Level 3 — Cost-to-Serve
Operational activities and resource consumption are included.
Question answered:
What does it actually cost us to serve this customer?
Level 4 — Job and Service Profitability
Profitability is analyzed by job, lane, service, warehouse activity, or transaction.
Question answered:
Which parts of the customer’s business make or lose money?
Level 5 — Predictive Profitability
Historical and current data is used to anticipate margin changes.
Question answered:
Where are we likely to lose margin next?
Most organizations should not attempt to jump directly to Level 5.
Reliable customer profitability begins with clean operational and commercial data.
The CFO and COO Need the Same Data for Different Reasons
Customer profitability is not only a finance exercise.
The CFO Wants to Understand
- Margin
- Cost
- Revenue leakage
- Pricing
- Contract economics
- Financial performance
The COO Wants to Understand
- Warehouse productivity
- Labor requirements
- Transport utilization
- Exception rates
- Operational complexity
- Service performance
These are not separate conversations.
They are two views of the same operating data.
If a customer is producing weak margins because it requires excessive manual handling, the CFO sees a margin problem.
The COO sees an operational problem.
The solution may be neither a finance adjustment nor a warehouse adjustment alone.
It may require a commercial decision:
- Reprice the service.
- Redesign the workflow.
- Change the service scope.
- Improve operational efficiency.
- Or reconsider the contract.
Profitability Should Influence Pricing Decisions
Many logistics contracts are priced using historical rates.
The problem is that operating conditions change.
Labor costs change.
Warehouse utilization changes.
Transport costs change.
Customer behavior changes.
Service requirements change.
A contract that was profitable two years ago may no longer have the same economics.
Customer profitability analytics gives commercial teams a stronger basis for pricing reviews.
Instead of asking:
“What price are competitors offering?”
the organization can also ask:
“What price do we need to maintain an acceptable contribution margin for this customer?”
That is a more strategic pricing question.
Contract Profitability Should Be Monitored Continuously
A contract should not be reviewed only when it is renewed.
The operating data generated during the contract provides evidence of whether the commercial assumptions remain valid.
For example:
Contract Assumption
→ 1,000 pallet movements per month
Actual Operation
→ 1,600 pallet movements
Contract Assumption
→ Standard handling
Actual Operation
→ Frequent special handling and repacking
Contract Assumption
→ Predictable transport
Actual Operation
→ Repeated urgent trips
Each difference can affect profitability.
The objective is not to penalize the customer for operational changes.
It is to ensure that commercial agreements reflect the service actually being delivered.
Billing Leakage Is a Profitability Problem Too
Profitability can deteriorate in two ways.
The business can spend too much.
Or it can fail to bill for work it has already performed.
For contract logistics, activities such as:
- Storage
- Handling
- Loading
- Unloading
- Picking
- Repacking
- Additional services
can create commercial value.
If those activities are not connected to billing, revenue leakage can occur.
This is why operational and financial data should not be treated as separate reporting streams.
The event that records the service should be capable of informing the commercial process.
The Store’n Ship-Fast platform describes connections between warehouse activities and billing references, illustrating this broader principle of linking operational events with commercial processes.
The Analytics Model Should Start With a Common Customer View
A practical customer profitability model can be built around six dimensions.
| Dimension | Example Questions |
|---|---|
| Customer | Who is generating the revenue? |
| Service | Which services are being consumed? |
| Volume | How much activity is taking place? |
| Cost | What resources are being consumed? |
| Revenue | What is actually being billed? |
| Margin | What contribution remains? |
The next layer adds operational context:
Customer → Contract → Job → Service → Activity → Cost → Revenue → Margin
This structure helps executives move from summary reporting toward root-cause analysis.
What Should a 3PL Measure?
A practical executive dashboard should include more than revenue.
Commercial KPIs
- Revenue by customer
- Contribution margin
- Margin percentage
- Revenue by service
- Contract performance
- Rate variance
Warehouse KPIs
- Storage utilization
- Handling activity
- Picking volume
- Labor consumption
- Inventory activity
- Exception activity
Transport KPIs
- Cost per trip
- Cost per shipment
- Vehicle utilization
- Empty kilometres
- Transporter cost
- Delivery exceptions
Freight KPIs
- Job revenue
- Freight cost
- Job margin
- Additional charges
- Documentation-related exceptions
Customer KPIs
- Customer profitability
- Cost-to-serve
- Service mix
- Exception frequency
- SLA performance
- Profitability trend
The important point is not to create a dashboard containing dozens of numbers.
It is to connect each KPI to a management decision.
The Question Should Be “Why?” Not Just “How Much?”
Suppose a dashboard shows:
Customer margin: 8%
That number is useful.
But management needs to know why.
Is the margin low because:
- Pricing is too low?
- Warehouse labor is high?
- Storage utilization is inefficient?
- Transport costs increased?
- The customer generates too many exceptions?
- Additional services are not being billed?
- A particular job or lane is unprofitable?
The analytical model should therefore allow executives to move from:
Customer → Service → Job → Activity → Cost
That is where profitability analytics becomes operationally useful.
A Practical 90-Day Approach
3PLs do not need to build a perfect profitability model before starting.
A practical approach can be phased.
Days 1–30: Establish the Baseline
Identify:
- Top customers by revenue
- Top customers by volume
- Major services
- Direct costs
- Current billing structure
- Available operational data
Do not attempt to model every cost immediately.
Days 31–60: Connect Revenue and Activity
Connect:
Customer → Service → Job → Operational Activity → Revenue
Then add the major direct costs.
Days 61–90: Identify Margin Drivers
Look for:
- High-cost customers
- Low-margin services
- Unprofitable jobs
- Rate mismatches
- Unbilled activities
- High-exception accounts
- Underutilized capacity
The goal is not simply to produce a new report.
It is to identify decisions that management can act on.
What Executives Should Do With the Results
Profitability analytics has limited value if it stops at reporting.
The output should lead to decisions.
If a Customer Is Profitable and Operationally Stable
Protect and grow the account.
If Revenue Is High but Margin Is Low
Review pricing and cost-to-serve.
If a Specific Service Is Unprofitable
Redesign the service or revise its commercial model.
If Operational Activity Is High but Billing Is Low
Investigate revenue leakage.
If a Customer Generates Excessive Exceptions
Measure the cost of those exceptions and address the underlying process.
If a Contract Is Consistently Below Target Margin
Prepare for a structured commercial review.
This is where analytics moves from reporting to management.
The Next Step: Predicting Profitability Before It Declines
Once historical profitability data becomes reliable, organizations can move toward predictive analysis.
For example, a 3PL could monitor whether:
- Customer volumes are changing
- Warehouse utilization is increasing
- Transport costs are rising
- Exception frequency is increasing
- Contract rates are becoming outdated
- Labor requirements are changing
These indicators can provide an early warning that customer profitability is moving in the wrong direction.
The future opportunity is therefore not just:
“Which customers were profitable last month?”
It is:
“Which customers, services, and jobs are likely to become less profitable—and why?”
That is a much more valuable question for an executive team.
The Strategic Shift
The 3PL industry has traditionally measured growth through:
Customers + Shipments + Revenue
The next level of management requires:
Customers + Services + Jobs + Cost-to-Serve + Margin
That shift changes how logistics companies make decisions.
A large customer is not automatically a good customer.
A high-volume operation is not automatically a profitable operation.
A growing contract is not automatically a healthy contract.
The organizations that understand these distinctions can make better decisions about pricing, service design, capacity, operations, and customer strategy.
For the CLO, customer profitability provides a clearer connection between operational performance and commercial outcomes.
For the COO, it shows where operational complexity is consuming margin.
For the CFO, it provides a more complete view of the economics behind revenue.
And for the CIO, it creates a clear business case for connecting operational and financial data.
The goal is not to replace operational reporting with another financial dashboard.
It is to connect the two.
Because the most useful profitability number in a 3PL is not simply:
“How much did this customer pay us?”
It is:
“What did it cost us to serve them, which activities created that cost, and what contribution did the relationship actually produce?”
That is the foundation of a more disciplined 3PL analytics model.
Conclusion
For 3PLs, revenue alone does not provide a complete picture of business performance. A customer can generate significant revenue while also consuming more warehouse space, labor, transport capacity, handling resources, and management effort than expected.
Customer profitability analytics provides a clearer view by connecting customers, services, jobs, operational activities, costs, revenue, and margin. This allows logistics leaders to understand not only how much business they are generating, but also what it costs to serve that business.